Kush is pulling data…
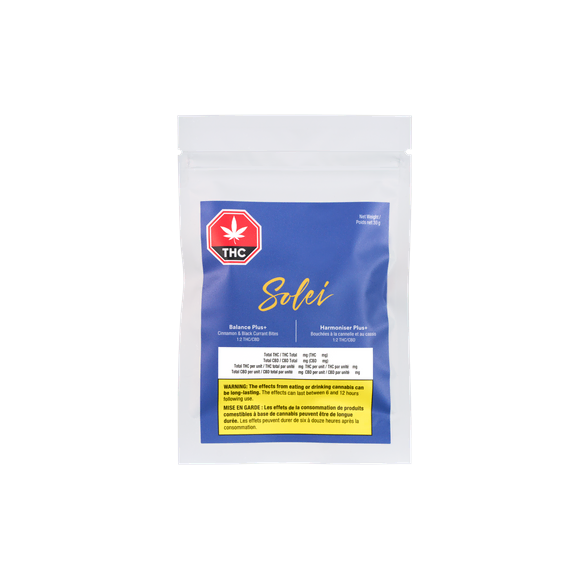
Bouchées Cannelle et Cassis +
UPC · 826966013423
Total historical $
$557K
2026 revenue
$127K
-65.1%
Years on shelf
3
peak 2025
% of Edibles
0.00%
in 2026
Rank in Edibles
—
Rank in 2 units
—
Peak year
2025
$365K
First seen
4/18/2026
last 4/21/2026
In-stock rate (our scraper)
100%
0 of 2 snapshots OOS
Tableau lifetime $
$557K
vs $557K yearly-sum
Sales by window
Derived from daily inventory ΔEOD · $ = units × price-on-date · peer group = same category + format
| Window | $ sales | Units | Grams | $ / day | Peer avg $ | vs peer |
|---|---|---|---|---|---|---|
3 days 2026-04-15 → 2026-04-17 · 3d | $3,333.80 $406K annualized | 422.0 140.67/day | 0.0 g | $1,111.27 | — | — |
7 days 2026-04-11 → 2026-04-17 · 7d | $8,081.70 $421K annualized | 1,023.0 146.14/day | 0.0 g | $1,154.53 | — | — |
1 month 2026-03-19 → 2026-04-17 · 30d | $35.3K $430K annualized | 4,469.0 148.97/day | 0.0 g | $1,176.84 | — | — |
3 months 2026-01-18 → 2026-04-17 · 90d | $101K $410K annualized | 12,800.0 142.22/day | 0.0 g | $1,123.56 | — | — |
YTD 2026-01-01 → 2026-04-17 · 107d | $119K $405K annualized | 15,018.0 140.36/day | 0.0 g | $1,108.81 | — | — |
Annualized (YTD) 2026-01-01 → 2026-04-17 · 107d | $119K | 15,018.0 140.36/day | 0.0 g | $1,108.81 | — | — |
Daily units · YTD
2026-01-01 → 2026-04-17
vs peer average · YTD
Self $
$119K
$1,108.81/day
Peer avg $ (n=0)
—
Self vs peer
—
Self annualized $
$405K
3.41× 10⁷d window
Annual revenue + cumulative
vs. peer group (Edibles · 2 units)
Rank over time
2024
Edibles: #0 / 0
2025
Edibles: #0 / 0
2026
Edibles: #0 / 0
Our live price tracking · daily
Rose dots mark out-of-stock observations. From the daily SQDC.ca scraper.
Product description
These cinnamon and black currant bites contain 5 mg of THC and 10 mg of CBD. This produit may give the impression of being more relaxed, increase the feeling of calmness and may uplift your mood. This product has fruity and sweet aromas. CAUTION! The effects may take up to 60 minutes to appear and may last up to 8 hours or occasionally longer.
Data · Tableau Cloud historical sales · sqdc.ca live catalog · 3 years · 0 stores